Where's the Data?
Chemical engineers frequently work with data from customers, processes, sensors, research activities, and physical property databases. On this page, you will find ChE-relevant data sets that are not part of competitions. Sometimes these data sets require cleaning; if you only want ready-to-analyze data sets, look here for data science challenges and contests that are of interest to chemical engineers.
Image by MonikaP from Pixabay
Data for Chemical Processes
Companies are obviously reluctant to publicly share real, raw data from their processes, because they want to maintain a competitive edge. Some companies work with individual researchers, but they normalize data to remove identifying information before sharing or publishing. Plus, it's expensive to induce a wide range of failure modes in real processes. Because of issues with data secrecy, access and variety, academics frequently rely on synthetic process data. If you'd like to simulate your own process, try OpenModelica.
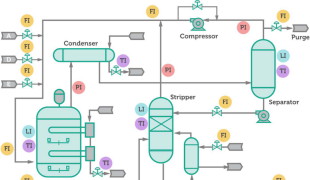
Image by Xiaolu Chen from IEEE DataPort
Tennessee Eastman
This Tennessee Eastman Process simulation features a typical chemical process with reactor, condenser, compressor, separator, and stripper.
Chen (2019) DataReith (2017) Data
Ricker (1996) Data
Matlab Code (UW)
Matlab Code (ASU)
F77 Code
F77 Python Wrapper
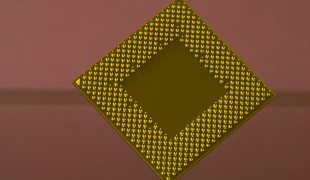
Image by tookapic from Pixabay
Semiconductor Process
With 591 unlabeled inputs for 1567 semiconductor wafers, this dataset has a go/no-go (1463/104) outcome with 42,000 pieces of missing data (4.5%).
Data: Text FilesDescription
McCann (2008)
Munirathinam (2016)
Salem (2018)
Github: Ditsworth
Github: Nakshatra
Chugh (2018)
Find Other Work

Semiconductor: Wafer Thickness
After a chemical vapor deposition process, thickness is measured at nine locations on 184 wafers.
Data: Excel FileDescription

Image by Dewald Van Rensburg from Pixabay
PRONTO Benchmark
Nineteen process variables are measured for a water-air system in a multiphase flow facility in the Process System Engineering Laboratory of Cranfield University.
Data: Excel & Text FilesArticle: Journal Site
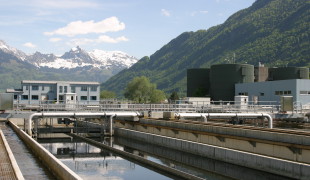
Image by kubinger from Pixabay
Water Treatment
Data for a water treatment plant, including 22 process inputs, 7 output measurements & 9 measurements of performance.
Data: .dat FileDescription
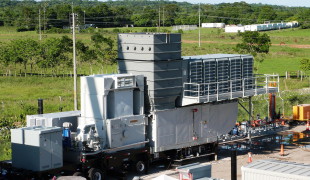
Image by Pedro Blanquicet Castano from Pixabay
Power Plant
Predict net hourly electrical energy output for a combined cycle power plant, using exhaust vacuum and 3 ambient variables (T, P, RH).
Data: Excel FileDescription
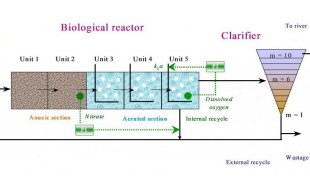
Image by International Water Association
Wastewater Simulation
To compare strategies for control, researchers use a benchmark simulation of a wastewater treatment facility.
Data: BSM1 ModelData: BSM2 Model
Description
Find Other Work

Image by fsHH from Pixabay
Ship Propulsion Plant
This 16-feature numerical simulation emulates a gas turbine propulsion plant on a naval vessel.
Data: Text FileDescription

Image by makunin from Pixabay
Open Data Wind Farm
ENGIE is making data available from it's La Haute Borne wind farm, whose four turbines have provided "electricity to the equivalent of 7,300 people since 2009."
DataDescription
Image by F. Muhammad from Pixabay
Data for Unit Ops & Equipment
Equipment manufacturers are more likely to share data -- and researchers can afford to purchase equipment and collect their own data -- for individual unit operations, such as compressors, pumps, separators, power sources, and more. Because the effects are local and economic & environmental impacts are greatly reduced, users have an opportunity to test a range of operating conditions, implement design changes, or induce a wide range of faults.

Image by Mike Vicic
Microbial Fuel Cells
Dowdy, Kawakita, Lange & Simmons (2018) performed a meta-analysis of 134 MFC experiments that use waste streams.
Data: Excel FileArticle: Journal Site
Article: Author Site

Image by Gerd Altmann from Pixabay
CO2 Gas Absorber
Evaluating an absorber in a CO2 capture process, Kachko et al (2015) built models using 6 variables (conductivity, pH, density, speed of sound, refractive index, NIR spectra).
Data: Excel FileArticle: Journal Site

Image by Krzysztof Kamil from Pixabay
Sensorless Motor Drive
Data from an ammeter and oscilloscope features are collected for a motor drive, while varying speed, load moment and load force for 11 states.
Data: Text FileDescription

Image by Jeff Berschling from Pixabay
Hydraulic Test Rig
Seventeen sensors are measured at different sampling rates (1, 10, 100Hz) for an hydraulic test rig.
Data: Text FilesDescription
Related Work
Image by M. Jarmoluk from Pixabay
Data for Individual Sensors
Data for individual sensors are often related to (1) long-term performance (drift) and reliability (failure modes) testing in the presence of a constant/controlled stimulus or (2) transient performance (response time) when sensors are presented with a step change in stimulus. For non-specific chemical sensors (or for chemical sensors with significant interfering substances), data sets often include results for a range of pure chemicals, mixtures, and flow conditions.

Image by skeeze from Pixabay
MOX Gas Sensors: Pure Species in Wind Tunnel
Data from 72 metal-oxide gas sensors that were deployed at six locations in a wind tunnel and exposed to 10 single-species chemicals.
Data FilesDescription
Article: Journal Site

Image by Gerd Altmann from Pixabay
MOX Gas Sensors: Drift
Data over 36 months from 16 metal-oxide sensors presented with six different chemicals, each at six concentrations.
Data FilesDescription
Article 1: Journal Site
Article 2: Journal Site
Image by skeeze from Pixabay
MOX Gas Sensors: Mixture in Wind Tunnel
Data from eight metal-oxide sensors presented with two gas sources that mix under turbulent conditions inside a wind tunnel.
Data FilesDescription
Article: Journal Site
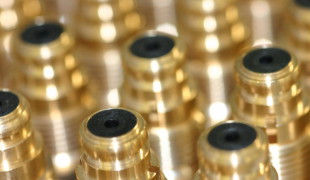
Photo by Diana Porter from FreeImages
MOX Gas Sensors: Mixtures
Data from 16 metal-oxide sensors -- four unique sensor types -- exposed to gas mixtures at varying concentrations.
Data FilesDescription
Article: Journal Site

Photo by Jonas Konski Ostergaard from FreeImages
MOX Gas Sensors: Respiration Simulation
Simulating biological respiration, an external mechanical ventilator delivered chemical mixtures in the presence of 16 metal-oxide gas sensors.
Data FilesDescription
Article: Journal Site

Image by Michal Jarmoluk from Pixabay
QCM Gas Sensors
Five Quartz Crystal Microbalance (QCM) gas sensors were exposed to 1-octanol, 1-propanol, 2-butanol, 2-propanol and 1-isobutanol.
Data: 5 Excel FilesDescription
Image by Bokskapet from Pixabay
Data for Chemical Research
To estimate molecular properties, we often use computationally expensive methods in quantum chemistry, but data science algorithms can reduce the time/expense of these calculations. This section focuses on microscopic molecular properties -- like dipole moments, polarizability, etc. -- while the next section centers on macroscopic molecular properties, like partition coefficients and biodegradability.
Image by D. Simone from Pixabay
Data for Material Properties
Measured physical properties are often related to fundamental molecular properties -- and sometimes to other measured attributes that are more readily available. This section focuses on macroscopic properties, such as critical temperatures, toxicity, and solubility.
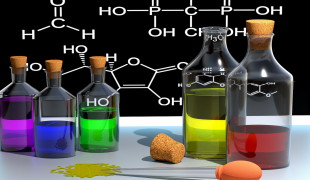
Image by MasterTux from Pixabay
Aqueous Solubility
Using nine molecular properties for a set of 2874 measured solubilities, Delaney (2004) performed linear regression to estimate aqueous solubility.
Data: Text FileArticle: Journal Site
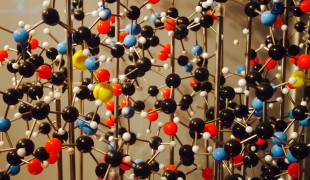
Image by Nobu Hirowumi from Pixabay
Biodegradation
Using molecular descriptors along with biodegradation experimental values of 1055 chemicals, Mansouri et al (2013) developed a QSAR model for biodegradability.
Data: Excel FileDescription
Article: Journal Site
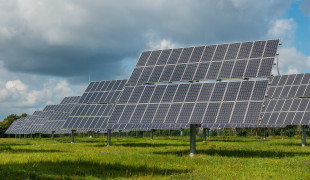
Image by Sebastian Ganso from Pixabay
Organic Photovoltaics
Backed by data from 1200 organic photovoltaics, Nagasawa et al (2018) used data-driven molecular design to improve power conversion efficiencies.
Data: Text FileArticle: Journal Site
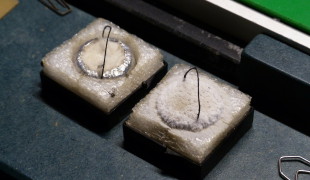
Image by Hans Braxmeier from Pixabay
Semiconductor Tcrit
Using up to 81 features for 21,263 different superconductors, estimate critical temperature.
Data: Excel FilesDescription
Original Source
Image by WikimediaImages from Pixabay
Physical Property Data for Molecules and Atoms
Multiple databases have been curated for atomic and molecular properties, including a combination of microscopic and macroscopic properties. This section features a handful of relevant data sources, which can be used in the two sections above.
Image by dlohner from Pixabay
General Data Repositories
Many organizations curate and host data sets, some of which have been highlighted above. These repositories have a wide range of data and are always expanding their breadth and depth. It might be worth taking a closer look at these sites, especially for biomolecular systems, medical, environmental, and satellite data, where are underrepresnted in previous sections on this page.

Harvard Dataverse
Social sciences account for 40+% of this 100,000-item collection, but the repository has 5,500+ datasets for chem, eng, env & med.
Search Dataverse

UCI ML Repository
Since hosting its first data set in 1987, the UC-Irvine Machine Learning Repository has expanded to include ~500 data sets.
Search UCI ML Data

IEEE DataPort
Datasets up to 2TB and in various formats can be stored and retrieved in this data repository. Relatively new and expanding quickly.
Search DataPort

Data Innovation
Although it doesn't host data sets, the Center of Data Innovation highlights and links to a different data set each week.
Recent Highlights

Kaggle
More than 22,000 data sets, many of which are tagged for relevant areas of science.
Tag: ChemistryTag: Biology
Tag: Environment

NASA DASHlink
More than 200 datasets, including PHM challenges, other contests, and more. Data mostly posted earlier than 2015.
Search DASHlink

AWS Data Registry
The Amazon Web Services (AWS) Open Data Registry lets people share data, with usage examples listed in search results.
Tag: BioTag: Sustainability
Data Is Plural Archive
Since Oct 2015, Jeremy Singer-Vine has been compiling data sources from his weekly "Data Is Plural" newsletter into a handy spreadsheet.
Google Doc

Google Dataset Search
Google Dataset Search was publicly released on Jan 23, 2020, providing access to more than 25 million publicly available datasets.
SearchMail List Sub
FAQ